Risk Matrices, Lies, and Misconceptions
Part 1 - Understanding Measurement
There are 3 examples below. For each example, use what you learned in today’s lectures to meet the following goals:
- Explain whether or not the example shown is a correct form of measurement
- Explain what scale of measurement is being utilized in the given example
- If the example shown is NOT a correct form of measurement, briefly explain how it is not properly conveying risk information
Answer:
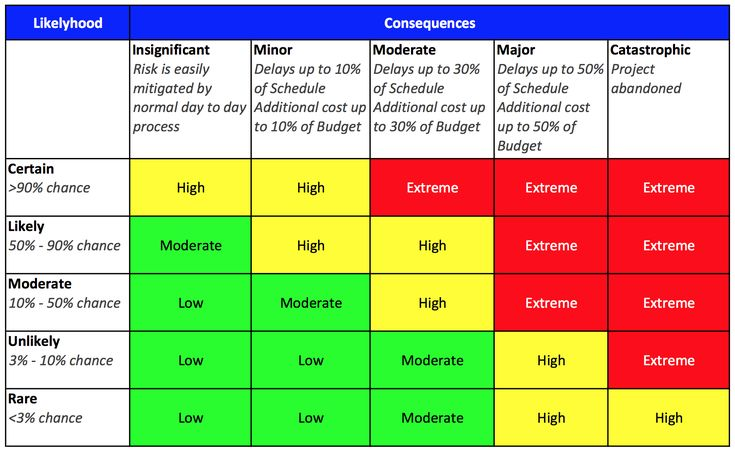
The second one doesn’t have any time scale so there is no reference and at some point everything becomes 100% possible.
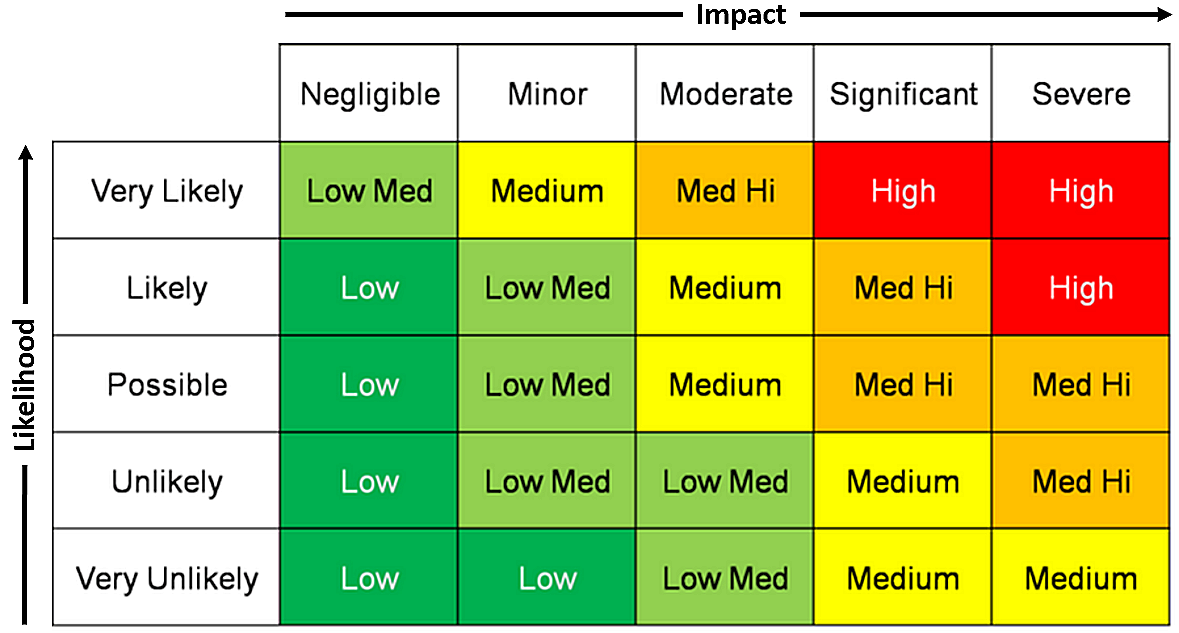
The last one has no reference so a medium for me could be a high for someone else.
Example 1:
Example 2:
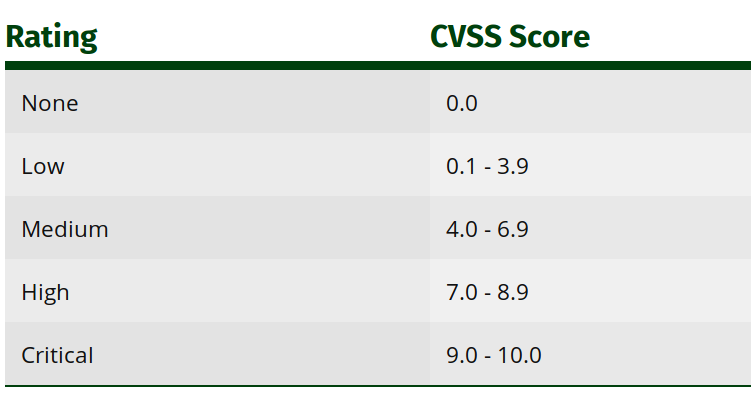
Example 3:
Part 2 - Building Threat Profiles
Briefly research a known threat group then, using your new understanding of FAIR Threat Profiling, create a small table with the information broken down by threat capability, threat event frequency (go find statistics on frequency), Assets, Harm, etc. Doing this will teach you how to build a sound threat profile that will become increasingly relevant in your career from both a DFIR and Cybersecurity perspective.
Examples of Threat Groups to choose from:
- ALPHV (BlackCat Ransomware)
- Lapsus$
- Conti
- DarkSide
- Lazarus Group
Threat Profile
| Type | Definition |
|---|---|
| Motive | To take down or stall the sectors they target |
| Primary Intent | Damage/Destroy |
| Sponsorship | Most likely Russian backed |
| Preferred Target Characteristics | Entries not in Russia that are critical infrastructure |
| Preferred Targets | Defense and aviation companies, government entities, companies related to industrial control systems, and critical infrastructure sectors |
| Capability | Very high level and advanced attacks |
| Personal risk tolerance | Very high |
| Concern for collateral damage | Very high |
FAIR Risk Factors
| TCom | TEF Min | TEF ML | TEF Max | TCap Min | TCap ML | TCap Max |
|---|---|---|---|---|---|---|
| Cyber Criminal (Backed by Nation State) | 0.25 (Once in 3 years) | 3 (three times a year) | 6 (once every 2 months) | 75 | 85 | 98 |
Hints and Helpful Tips
- For Threat Event Frequencies, find data on your chosen threat group. Can you find data on attributed attacks? Maybe you can find news of attacks 10 times a year, maybe 10 times a month? Determine an average, a minimum, and a maximum from this data. These will be estimates
- For Threat Capabilities, take a look at the tactics employed in any published breaches/attacks. Use your best judgment as to what levels of force, out of 100, your threat group is capable of employing against an asset. Do they have any instances of non-destructive attacks (1-10 TCap)? Do they have a history of destroying assets entirely (95-100 Tcap)? This will help you determine your minimum, “most likely”, and maximum capability levels.
Part 3 - Measurement and FAIR
Briefly reflect on how you can combine the two topics of measurement and threat profiling together to perform real-world risk analysis utilizing the FAIR model. How does measurement play a role in FAIR? Why does FAIR work in this regard when other models don’t?
Answer:
Measurement is key to FAIR modeling because it can show the frequency of a potential event occurring, potential loss in the event of an incident, and the degree of uncertainty associated with these factors. The FAIR model works well in this regard because it provides a systematic approach for measuring risk and combining threat profiling with quantitative risk analysis. Unlike other models that rely solely on qualitative assessments or subjective rankings. By combining threat profiling with quantitative risk analysis, the FAIR model enables organizations to identify and prioritize the most significant threats to their operations and develop targeted risk mitigation strategies to address those threats.